D. BI – Business Intelligence 

D.1. F&B Global Sales


Through this section we will know between the dates that we indicate (by default the previous month), from/to department, by day of the week the totals of FOOD, DRINK and OTHERS (A&B or F&B)

It can be selected exclusively from one time slot. B.7.

In case of large numbers, you can enable the bullet of thousands.

D.2. F&B Stats

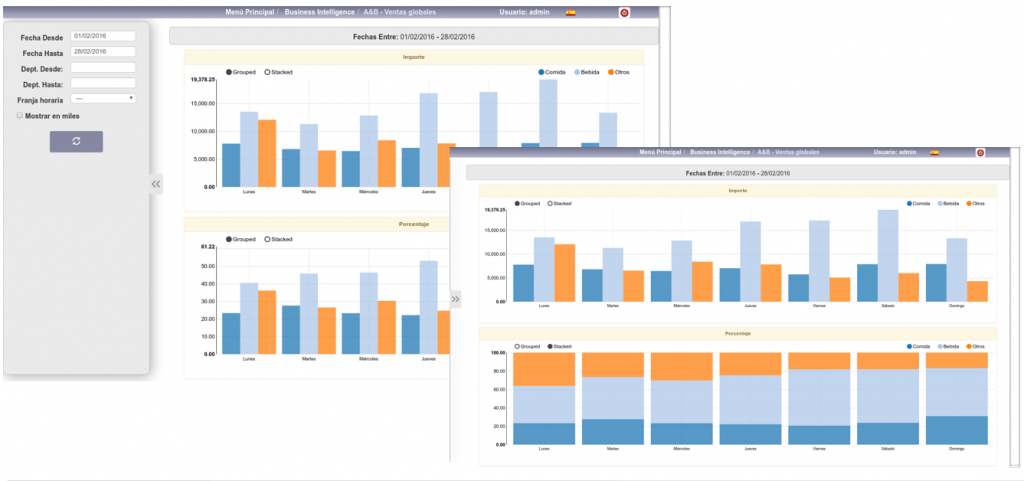
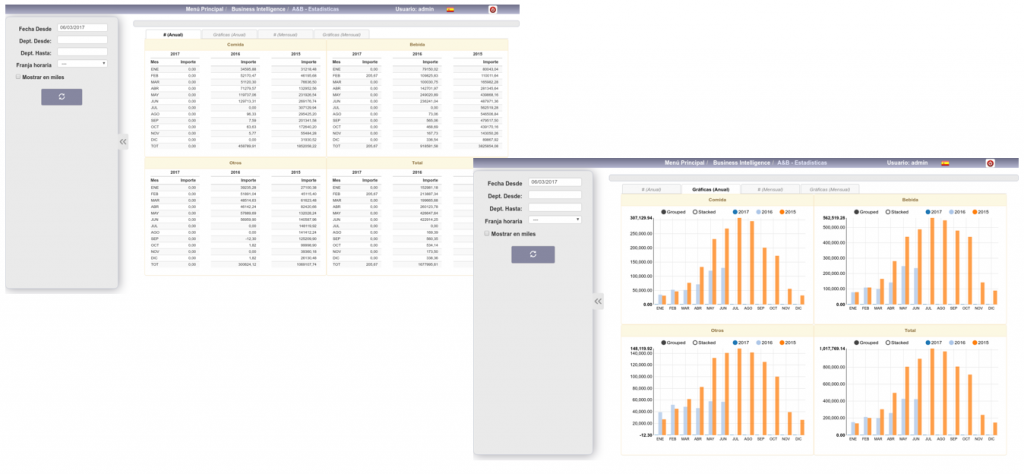
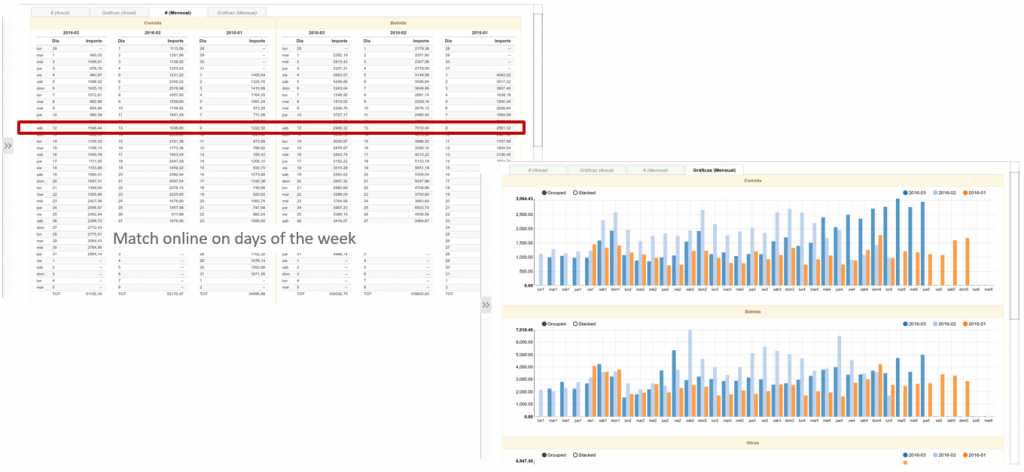
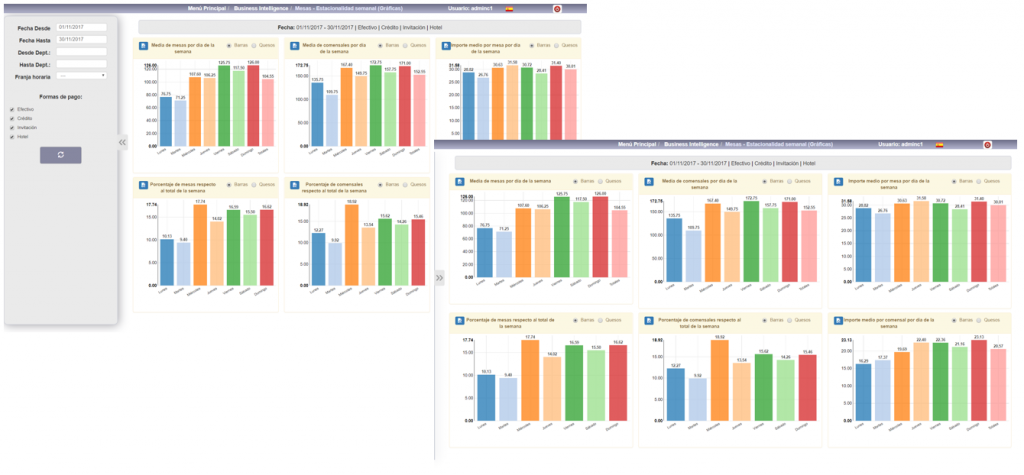
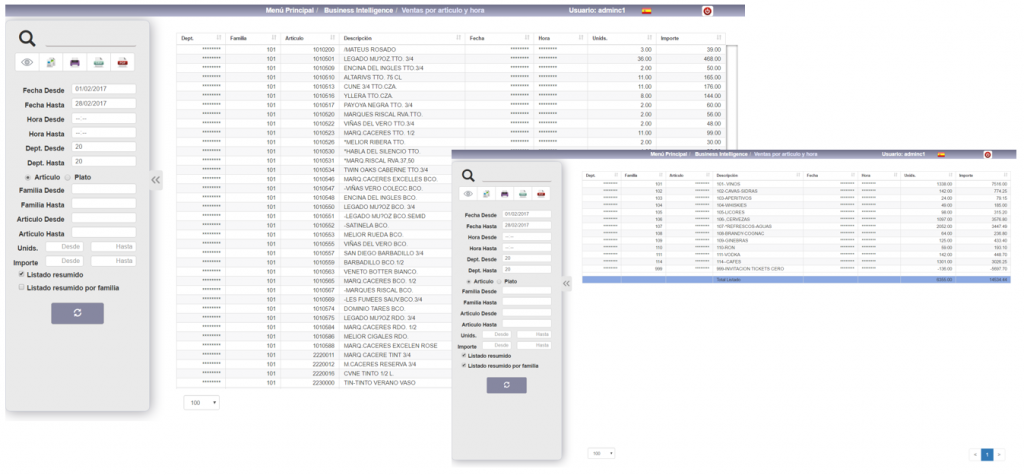
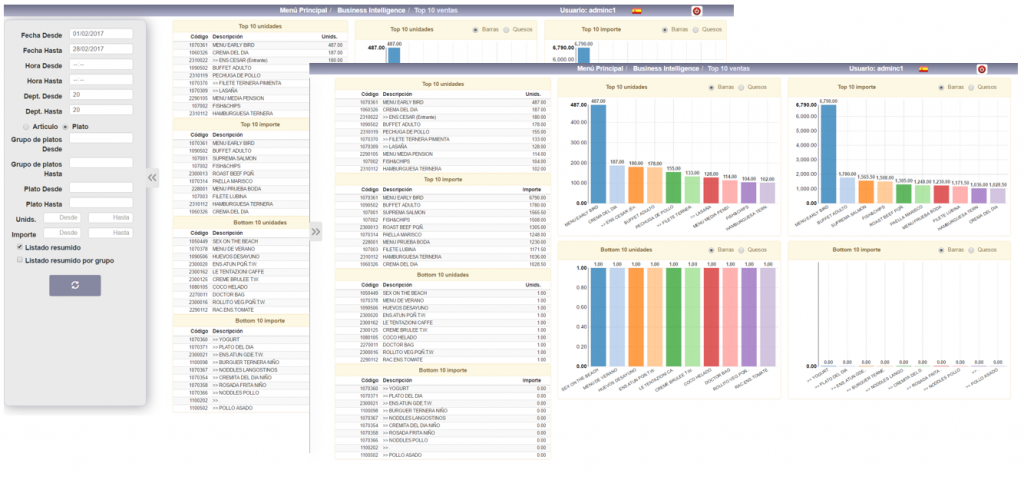
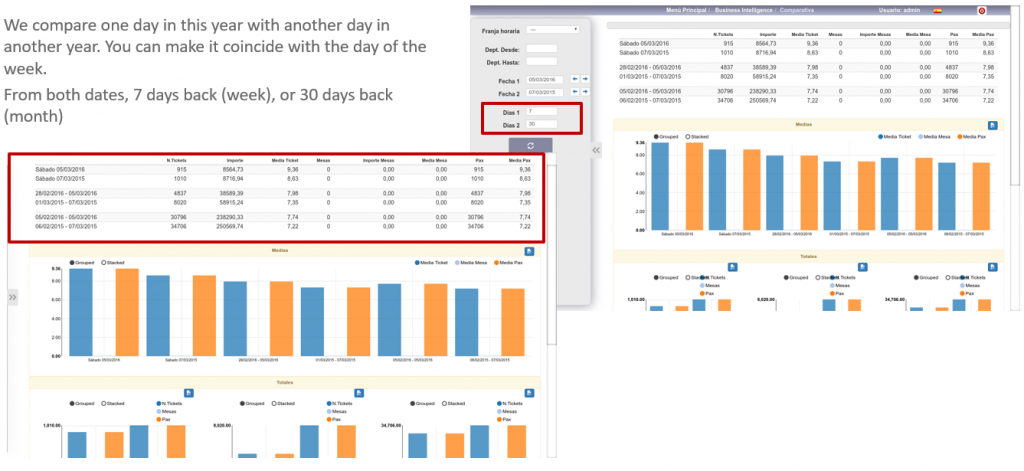
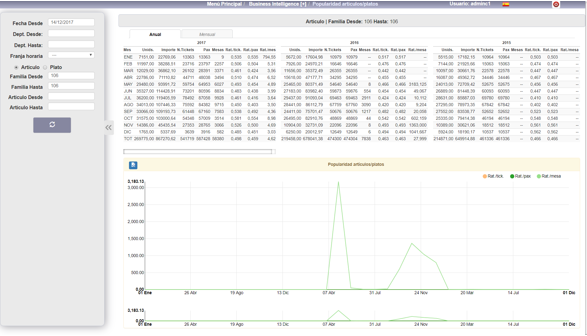
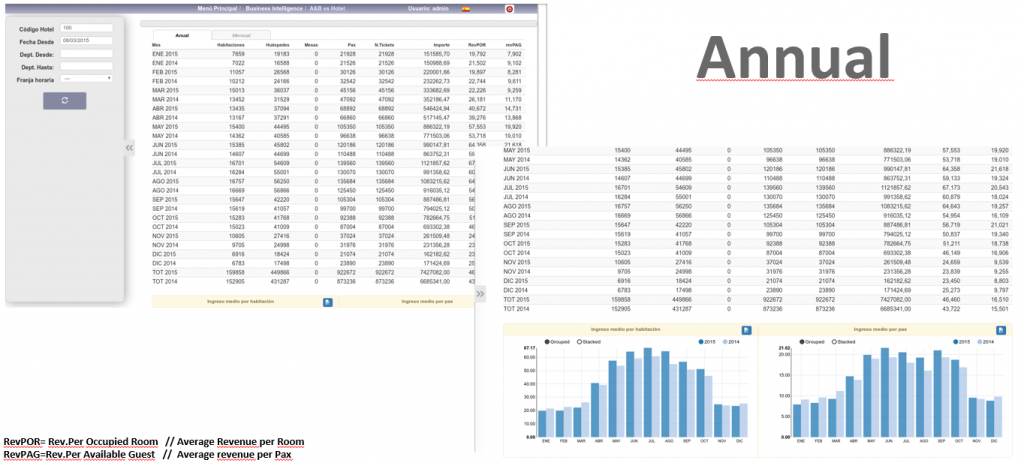
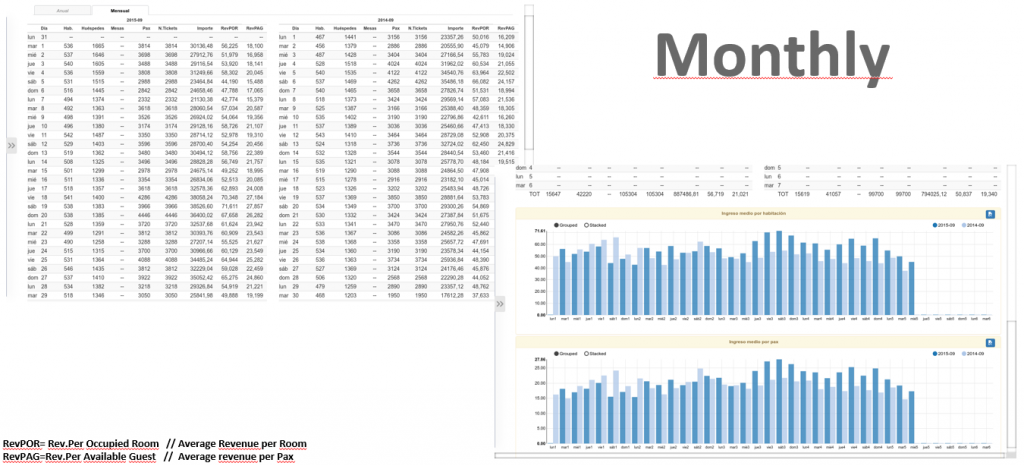
We will be able to see the comparatives of 3 years, or 3 months of FOOD, DRINK and OTHERS (A&B or F&B), with their corresponding graphs.

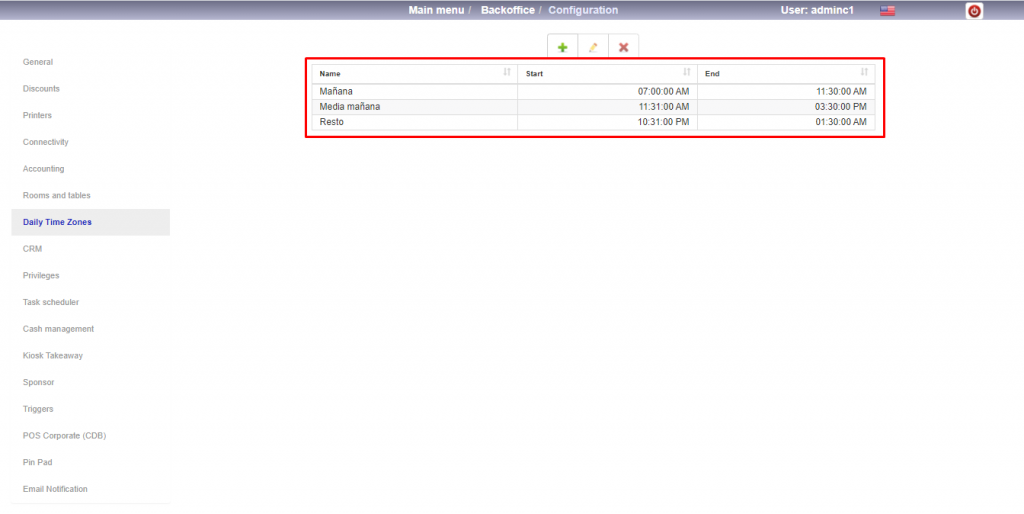
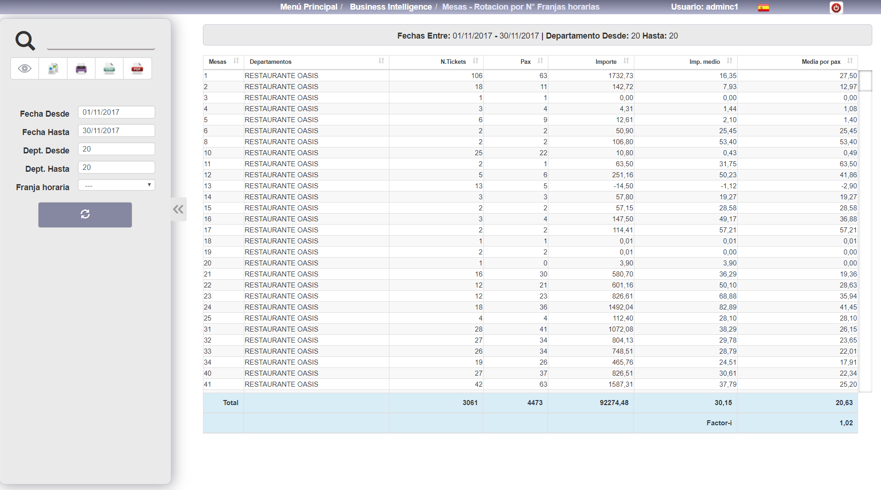
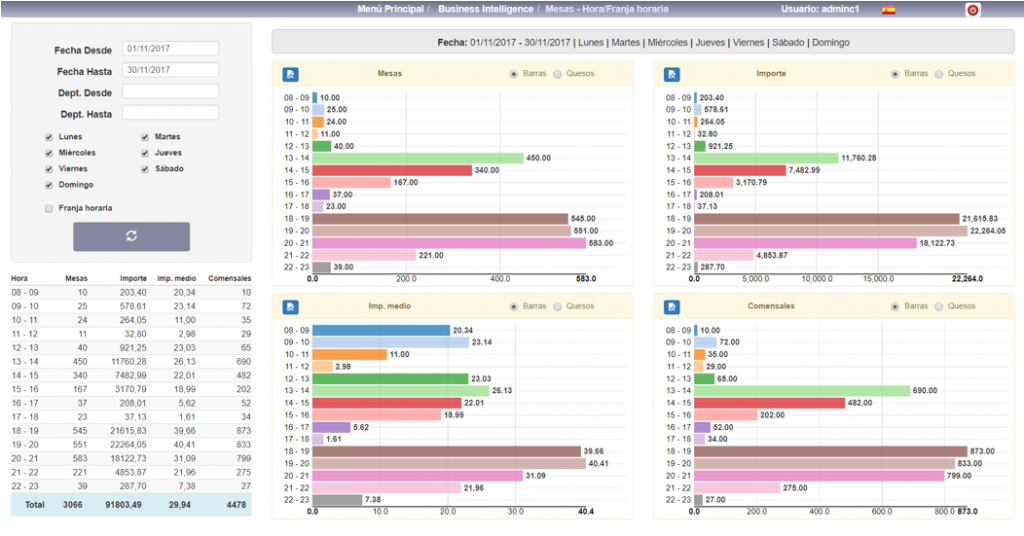
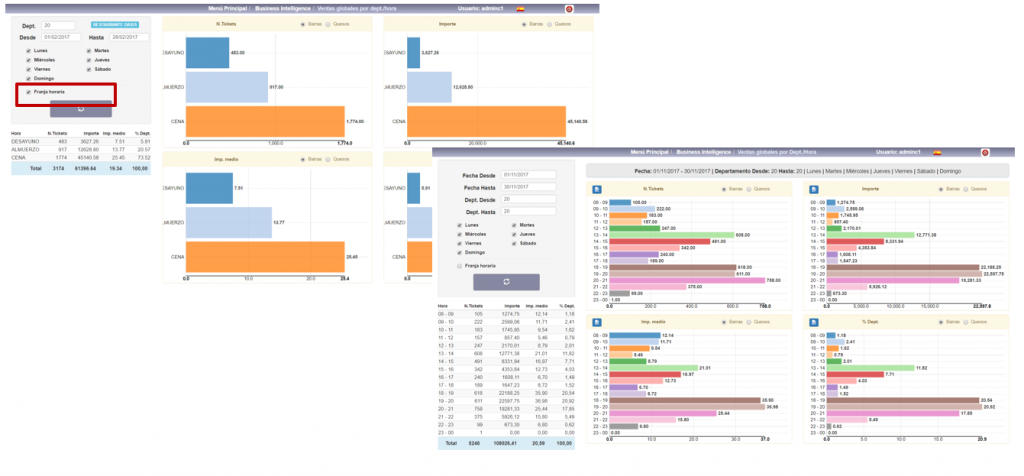
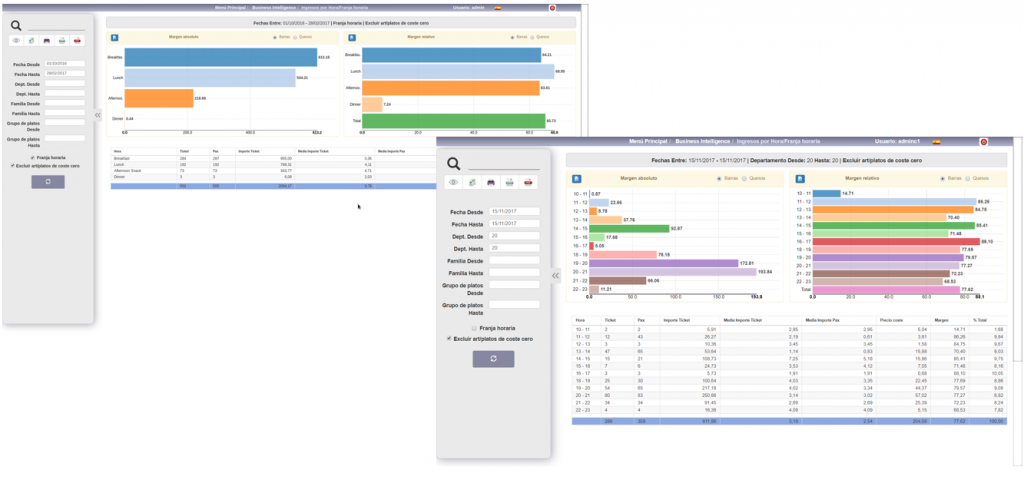
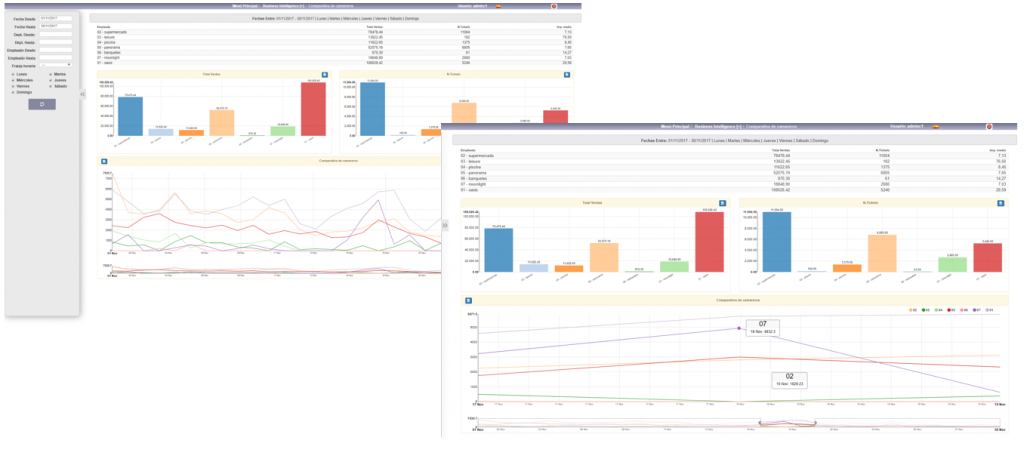
It can be selected exclusively from a time slot. B.7.

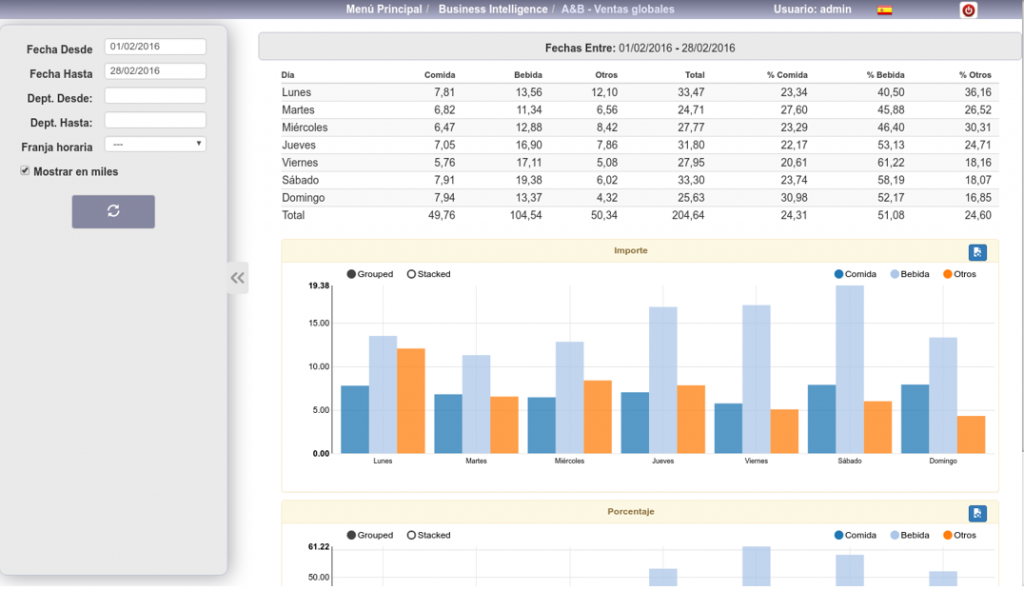
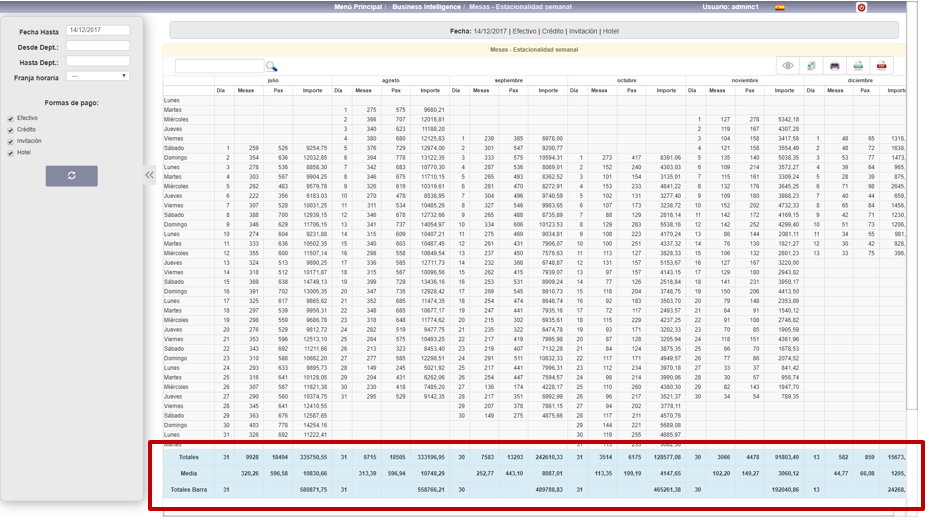
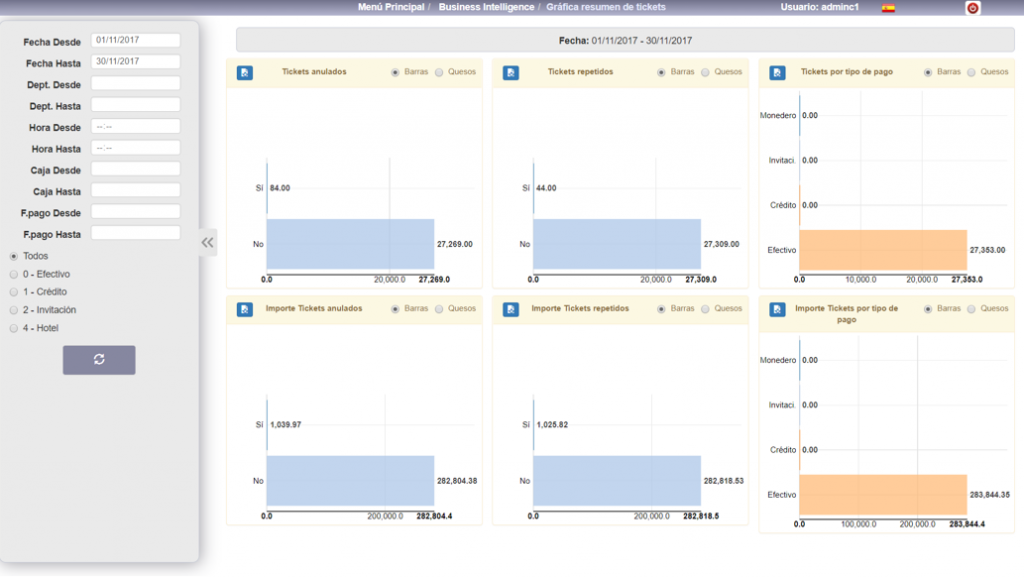
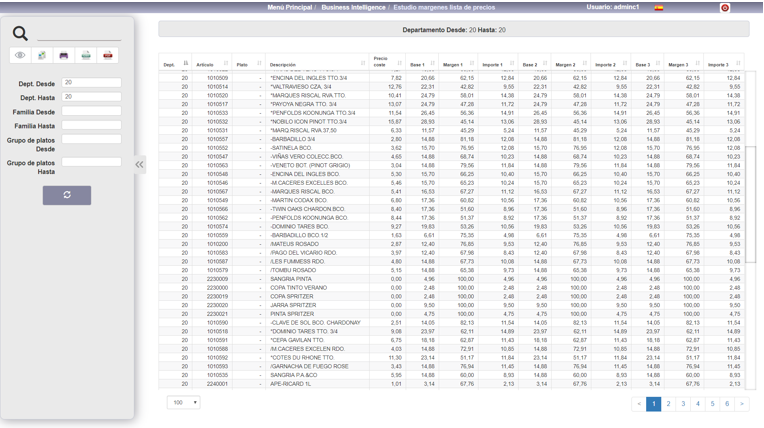
In case of large figures, you can enable the bullet of thousands.

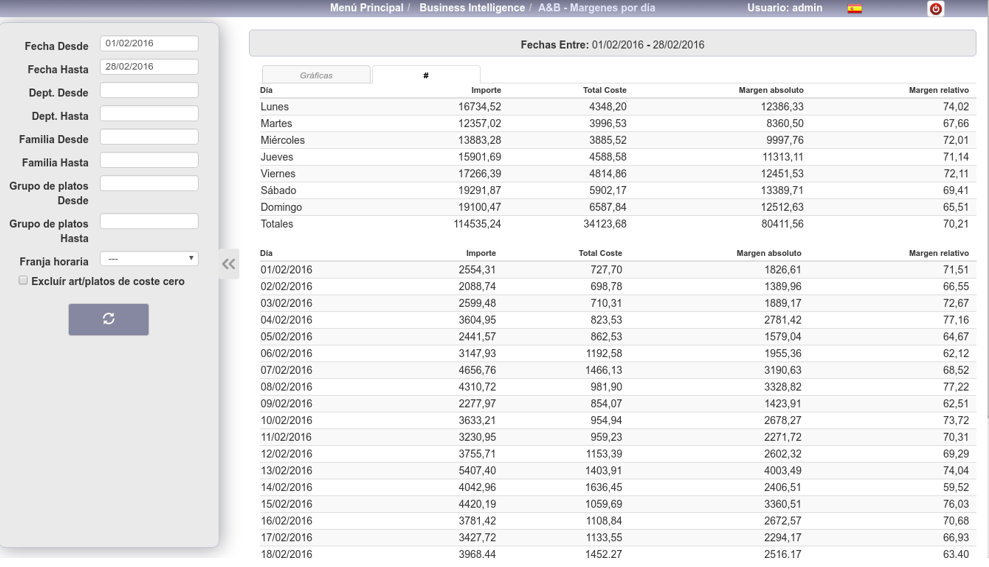
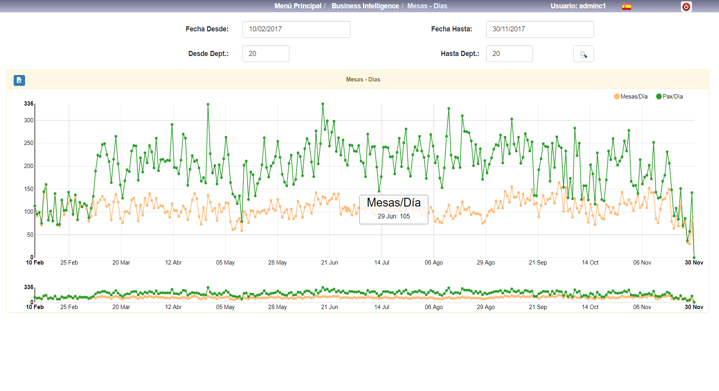
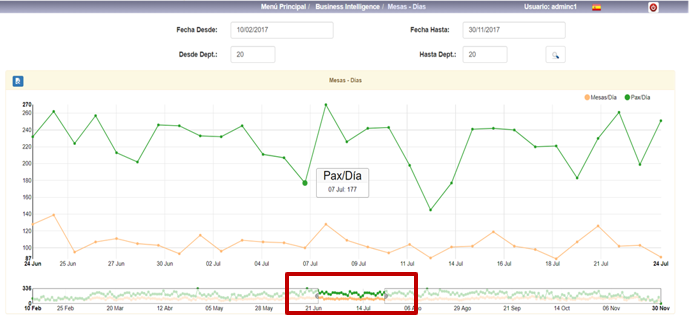
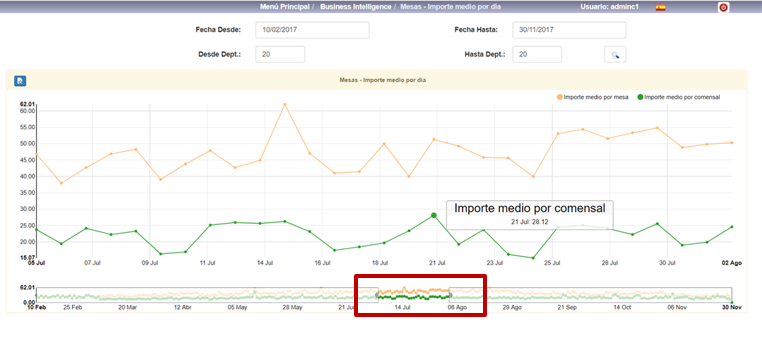
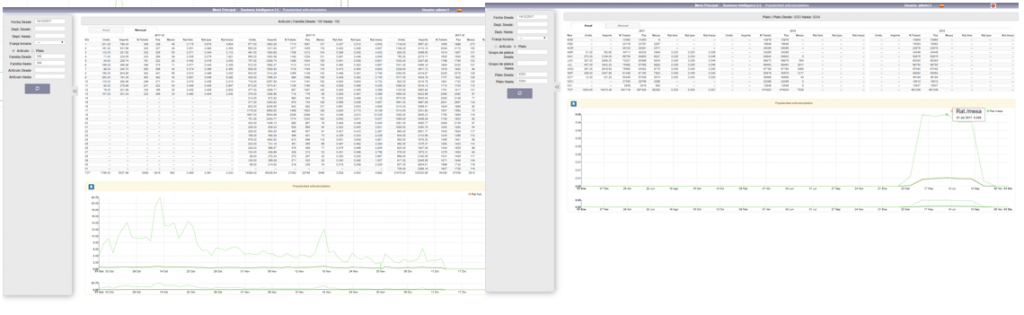
In the monthly comparison, the days of the week (Tuesday to Tuesday) are shown

D.3. F&B Margins per day


We will be able to see margins of FOOD, DRINK and OTHERS (A&B or F&B), with their corresponding graphs, according to the dimensions that we make


This process may take some time to run, as it must match StarPOS with StarEcon

D.4. Tables – Rotation per Times zones


We study the occupation for each number of tables, in order to determine which physical tables give us the best performance, so that we can rearrange the situations of the tables within the rooms.

D.5. Tables – Week seasonality


A period of 6 months is studied to calculate the seasonality of a given department or departments, so that we can know which are the best days of the week.

D.6. Tables – Week seasonality (Charts)

D.7. Tables – Hour/Time zone

D.8. Tables – Days

If we mark with the mouse in the graph below and make a box, we can better study that particular period, we can also move it, expand it, …

D.9. Tables – Average amount per day

If we mark with the mouse in the graph below and make a box, we can better study that particular period, we can also move it, expand it, …

D.A. Global sales per Department/Hour

D.B. Articles per hour

D.C. Top 10 Sales

D.D. Tickets summary chart

D.E. Articles/Dishes quadrature

D.F. Income per Hour/Time zone

D.G. Comparative

D.H. Margins report in Prices List

According to the data we have from the Price List, we calculate the margins at which we are operating on the three sales prices and always without taxes (VAT/IGIC/IGI/VAT/…).

Cost Price | Sales Price Base | % of Margin | Amount difference between PC and PVP


It is good that we study our sales prices, with respect to cost prices.

Sometimes we can get some not very nice surprises

D.I.1. Articles/Dishes popularity

We can know exactly the Popularity of a certain Article, of a set of articles, of a family, set of families, Dishes, set of dishes, Groups of Dishes, set of Group of Dishes, …, of the last 3 years (month by month) and of the last 3 months (day by day)

In order to have a broader view we have the following data:

Units sold | Sales amount | Total number of tickets | Total number of people | Total number of tables

And thus obtain the Ratio per Ticket, Ratio per person and Ratio per Table, with which you can always study the launch of new products and know from the people/tables/tck that there has been in the establishment the popularity of the same with respect to the total.

If 80526 people have entered and 615 have consumed it, ….

D.I.2. Waiters comparative

D.I.H. F&B vs Hotel

×